The past few years has seen the development of advanced interactive graphical analysis tools reach the mass market. Gartner's "Magic Quadrant" puts Tableau near the top in their analysis.
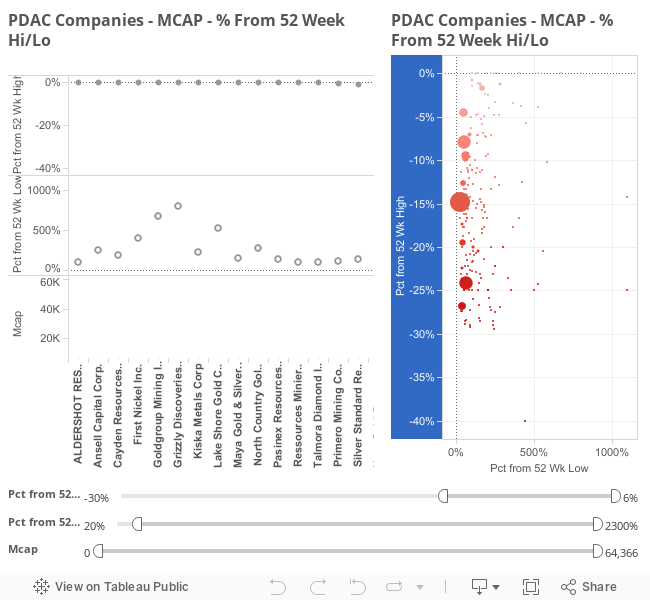
The dashboard below takes the PDAC stock watchlists (and these rely on google finance data so please always double check) and makes the analysis of stronger performing stocks more visual and interactive. Also note that the datalink is via google / via excel (!!) so I will note the last refresh date here:
Refresh 15th March 2014.
To interact drag the sliders, highlight areas of the chart on the right or click to re-sort the values in the left hand graphs
No comments:
Post a Comment